|
|
Impact of routing on End-to-end Internet performance Les Cottrell Last Update: March 29, 1999 Central Computer Access | Computer Networking | Internet Monitoring | Tutorial on Internet Monitoring |
|
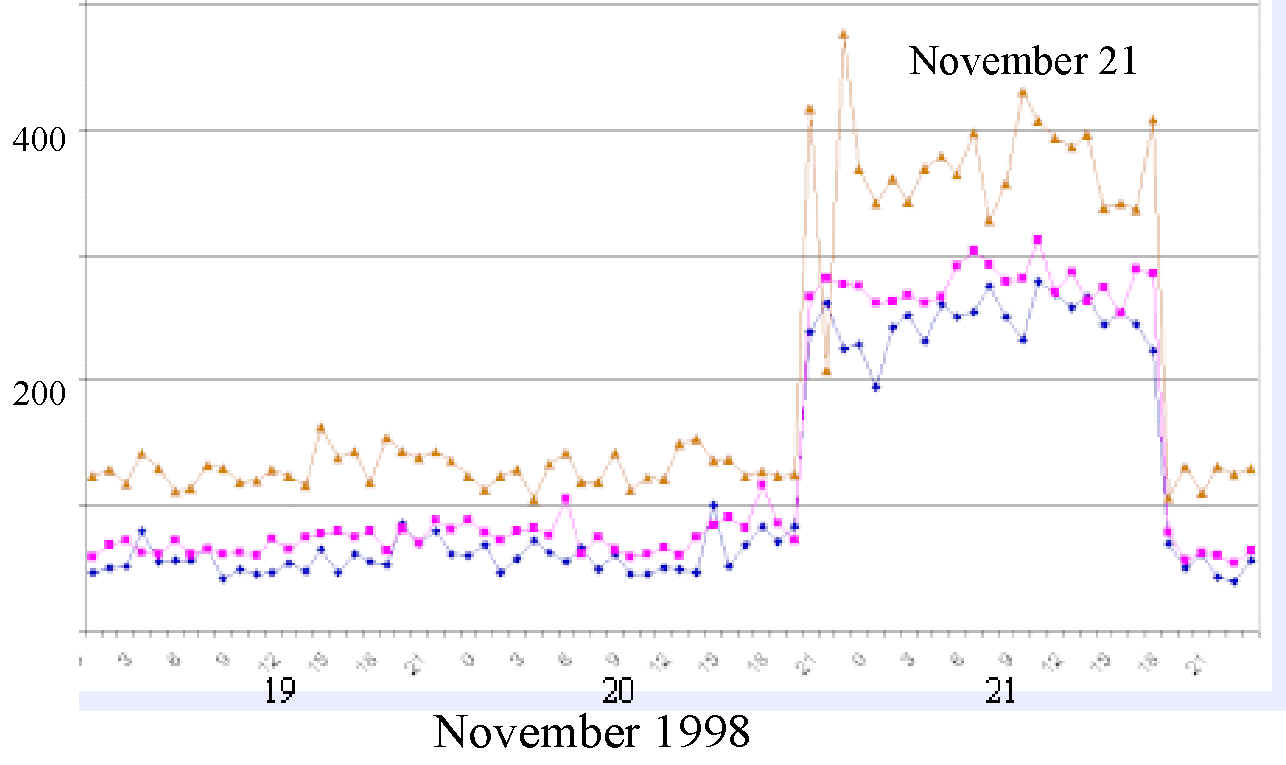
An example of a short term routing change can be seen in the figure below that
shows the response time in milliseconds measured each half hour between 4
monitoring sites in the US to NIST in Gaithersburg Maryland.
It can be seen that
around 21:00 on November 20th until around 18:00 on November 21st there was
a sudden increase in the response time of an additional 150-250 milliseconds.
The cause is believed to be
a change in the routes that diverted them via the NIST campus in Boulder,
Colorado.
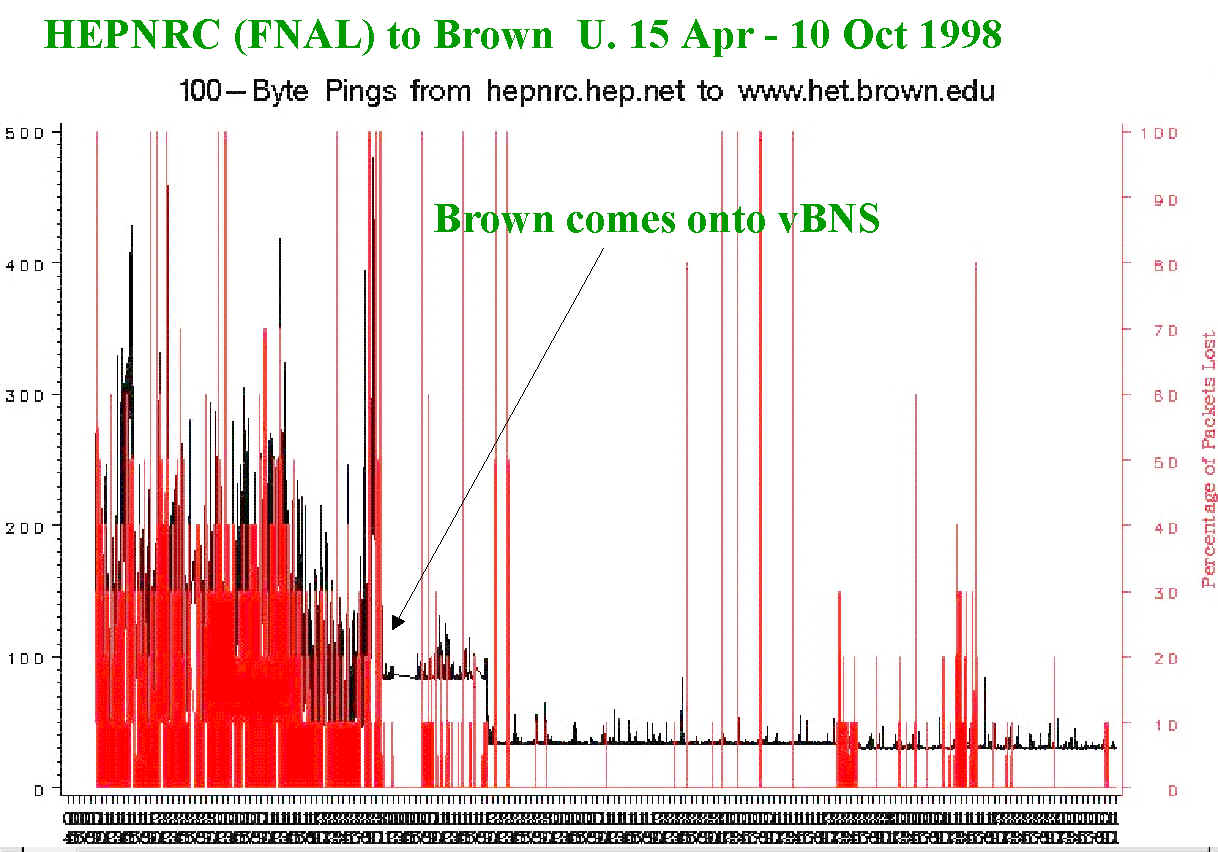
An example of the change (in this case an improvement) obtained when a site
(Brown University)
changed its Network Service Provider, in this case moving to vBNS can be seen
below. The measurements are for each half hour, the black indicates the
response time in milliseconds, and the red the percentage packet loss. The
dramatic improvement in response time and packet loss as Brown moves onto vBNS in
June 1998, is immediately apparent.
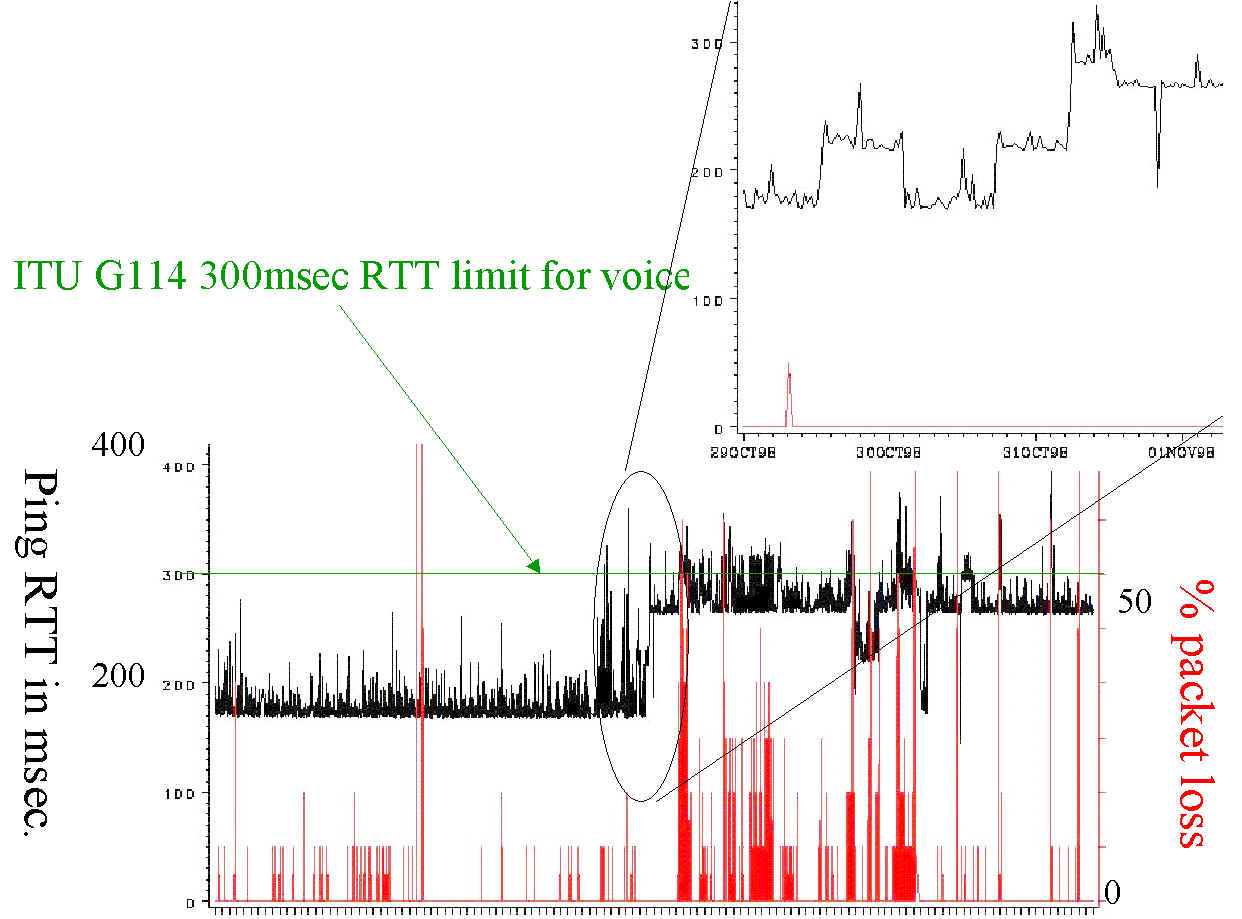
The figure below shows the response time in milliseconds
and % packet loss, for each half hour from
September 1998 thru November 1998,
between SLAC (Silicon
Valley/San Francisco Peninsular) and KEK (near Tokyo Japan).
The black line is for the response time (Round Tript Time - RTT)
and the red line is for packet loss.
Around the end of October 1998, KEK's (Japan) traffic to SLAC was
rerouted via STAR-TAP in
Chicago instead of going more directly via the Sprint Oakland POP. As can be seen
in the figure this increased the response time by about 80-100 milliseconds. Also
shown in this figure is the detailed behavior at the time the changeover was
made, and the green line shows the ITU G114 300 millisecond threshold for
RTT under which toll quality voice is possible.
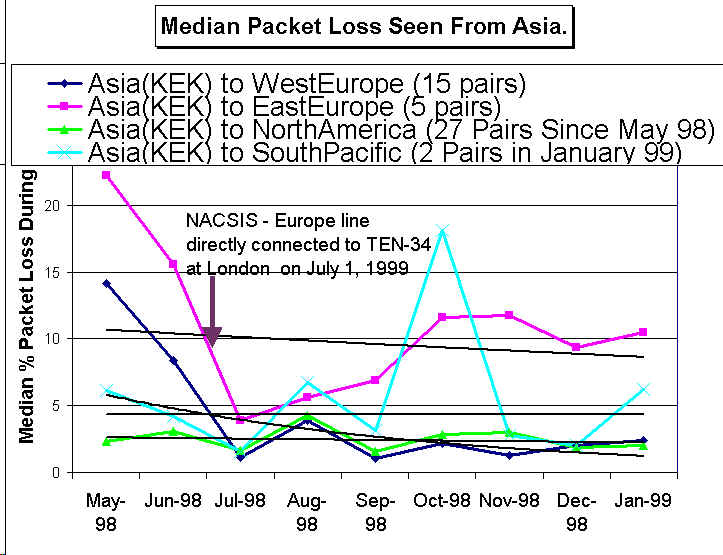
The figure below shows the median % monthly packet loss measured from KEK to
various remote sites which have been grouped by area. The areas are indicated in
the legend together with the number of monitor-remote site pairs in parenthesese
that contribute to each group. It can be seen that the direcyt connection of
the NACSIS (Japan) line to Europe at the start of July 1998
made a dramatic improvement in the packet loss between KEK and Europe while
having little effect on the N. American remote sites.
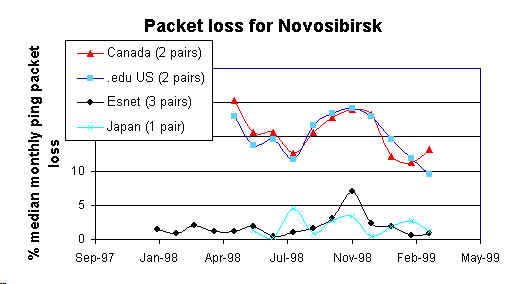
The figure below shows the median % packet loss for the Budker Institute
of Nuclear Physics (BINP) in Novosibirsk measured from various monitoring
sites in Canada, the U.S. and Japan. The top two curves (red and blue) are for
Canadian and .edu monitoring sites (the number of monitoring sites are
shown in the
legend in parentheses), and are seen to have performances several times worse
than when measured from ESnet monitoring and Japanses sites. This can be
understood by looking at the routing. The routes from Canada and .edu cross the
Atlantic and go via the Deutsches Forschungs Network (DFN) to DESY (Hamburg,
Germany) where they go via a single satellite hop to Novosibirsk. The
routes from
ESnet go across the pacific to KEK Japan and then via a fiber optic link to
Novosibirsk. The trans-Pacific/fiber route is seen to be much better than the
trans-Atlantic/satellite route.
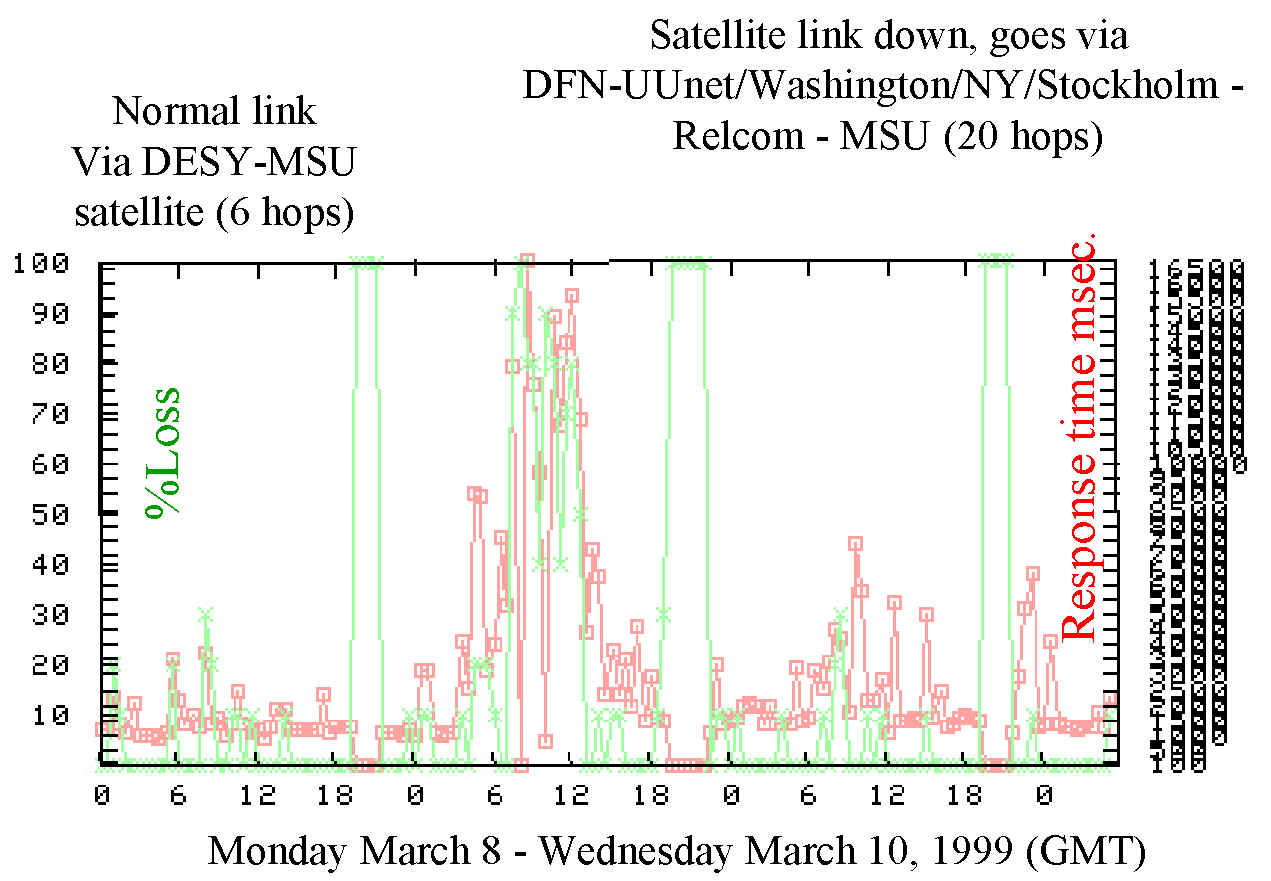
The figure below shows the % packet loss (green) and RTT (red) in milliseconds
measured from DESY to Novosibirsk between March 8th and 10th 1999. the
measurements are for ten 100 byte pings made each half hour. It can be seen that
each day from about 17:30 thru 19:00 one observes 100% packet loss. When one
examines the routes most of the time the route is very direct (via satellite with
a minimum round trip delay of about 1 second)
from DESY to Novosibirsk, however, between 17:30 and 19:00 the route travels
twice across the Atlantic and goes via DFN, UUNET
(Washington, NY, Stockholm) and
Relcom. Obviously this backup route is very poor with ~ 100% packet loss.
Further investigation reveals that the satellite is in the shadow of the
earth between 17:30 and 19:00 at this time of year, and the operators shut it
down to save the batteries.
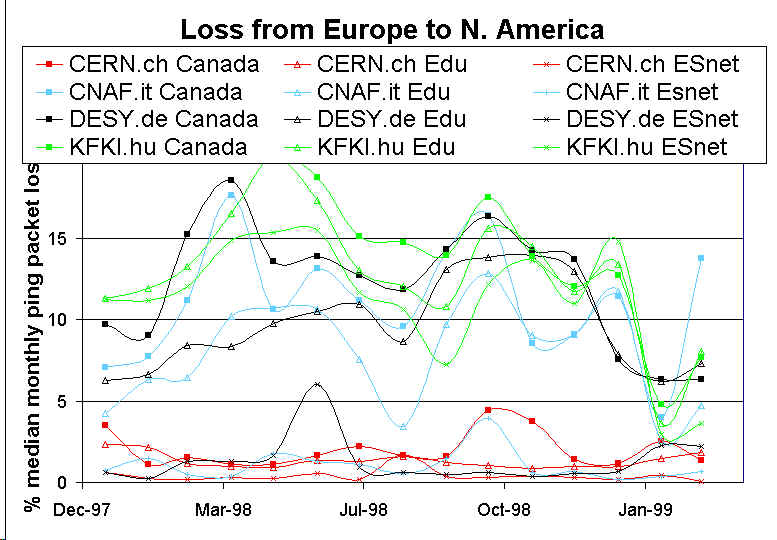
The figure below shows the median % monthly packet loss measured at European
sites for remote sites in N. America. Roughly speaking the curves are divided
into two sets, those with good to acceptable (< 2.5%) loss and those with
very poor to unusable (>> 5%) loss. In the former set, CERN has dedicated
bandwidth (4Mbps at the time) to N. America, and DESY and CNAF/Italy had
dedicated (1.5Mbps) to ESnet. It can be seen that this dedicated bandwdith leads
to good to acceptable performance. The other routes even though typically
having much more bandwdith (e.g. the DESY/DFN link to N. America was 90Mbps,
the INFN/GARR lnk was 45Mbps) shared this bandwidth with a large Research and
Education (R&E) community. The improvement around the end of the year
was partially due to the holiday season, and also KFKI/Hungary started to
share the TEN-155 155Mbps trans-Atlantic link.
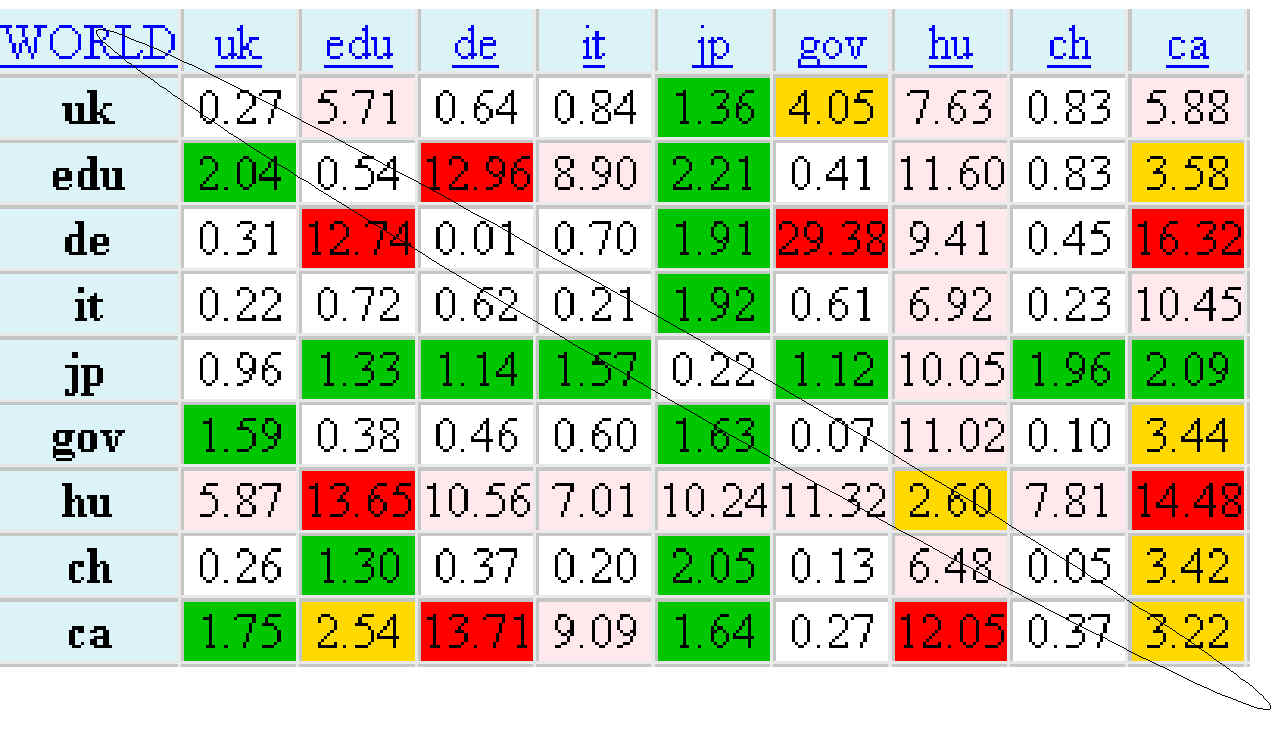
The figure below shows the monitoring sites grouped by Top Level Domain (TLD)
across the top and the remote monitored sites grouped by TLD along the left
column. Each cell in the table shows the median monthly % ping packet loss for
February 1999, colored according to: white (good) <=1% loss, green
(acceptable) >
1% & <=2.5%, yellow (poor) >2.5% & <=5%, pink (very poor) >
5% & <=12%, red (un-usable) > 12%.
One can notice that the diagonal values (i.e. the traffic stays within a TLD) are
generally better than the off-diagonal values. This is a consequence of the fact
that performance is generally improved by reducing the number of Network Service
Providers (NSPs) or Internet Service Providers (ISPs) routes need to pass
through. This is strongly advocated by the
Automobile Nextwork eXchange (ANX) consortium who have a very
stringent Service level Agreement (SLA) with their providers.