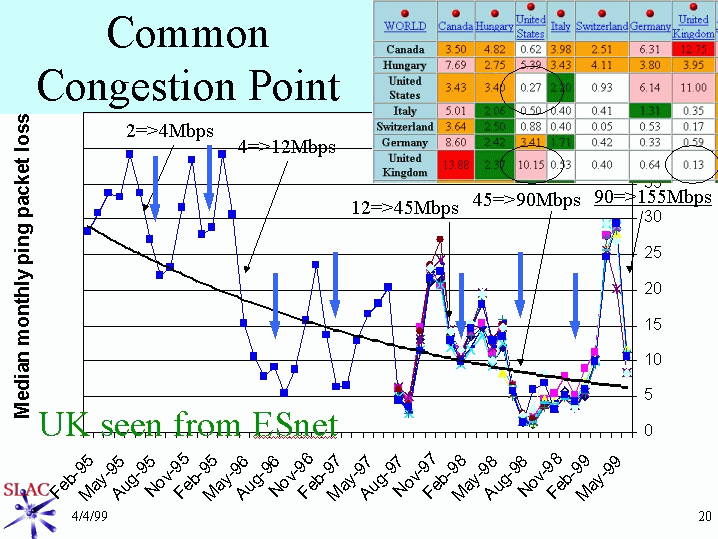
The arrows from the top indicate when the UK-US Research and Academic link was
upgraded and by how much, starting from 2 Mbps in Jan-95 to 90 Mbps in May-98.
The arrows from the botton indicate the major holidays (mainly the New Year
periods). The black line is a least squares fot to an exponential with a slope of
about 0.01% per month. The chart shows the rapid saturation (within a few
months), as evidenced by
bad packet loss (> 12%), following the major upgrades to the link. It also shows
the effect of holidays (the vertical blue arrows indicate holiday periods) on the performance.
The table at the top right corner indicates the packet loss percentages for the month of April
1999 between sites in different countries. It can be seen that packet loss is low (< 1%)
within the UK and within the the U.S., however between the U.K. and U.S. packet loss is
bad to unacceptable (> 10 %). This is caused by the congested trans-Atlantic link and the
interconnects to the networks in each country.
[ Feedback ]